In order to test some location data generated by an embedded application I’m developing for one of my clients, I need to plot tracks on a map. I already used QGIS 10 years ago, and I have kept in mind that it was supporting Python scripting. This could accelerate my tests a lot. So, let’s go for it.
Installing QGIS in Linux Mint 20.3
I download and install the Debian/Ubuntu package according to the documentation.
Downloading map data
I download map data I need from Geofabrik website, in shape file format (I tried to use osm.pbf format, but displaying layers took too long).
Displaying location data
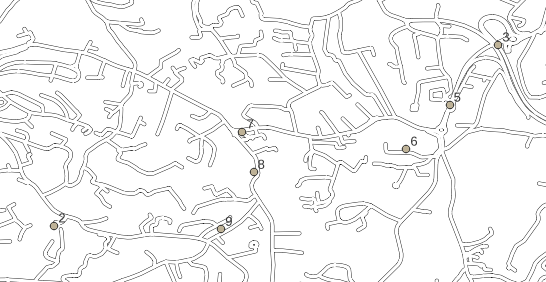
To display location data on the map added in the previous step, one possible way is to create a CSV file containing three columns at least, from my test data: a unique identifier, latitude and longitude.
Latitude and longitude must be expressed in the same Coordinate Reference System as the one used by the map. When playing with data generated by a GNSS receiver, the right one is WGS84 (also referenced as EPSG:4326 in QGIS).
To display the content of the CSV file:
- Layer > Add Layer > Add Delimited Text Layer…
- Select the file
- In Geometry Definition, set Geometry CRS to EPSG:4326
- Click Add button
To display the unique identifier, right click on the layer name in the Layers panel, and select Show Labels.
To display the whole set of test location data, right click on the layer name and select Zoom to Layer(s).